Remote debugging finally comes built into Mac OS and iOS 6. All you need is Safari 6 (which is, as the windows version of Safari was discontinued silently, only available on Mac OS) and the afore mentioned iOS 6.
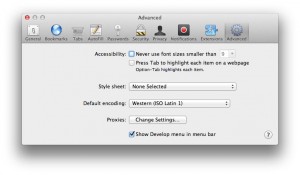
If not done so already you have to turn on the Developer menu in the safari settings.
On the device, go to ‘Settings’ – ‘Safari’ – ‘Advanced’ and turn on ‘Web Inspector’ (which was translated to ‘Webinformationen’ in german).
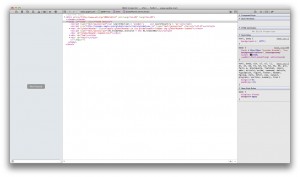
Once you connect your device thru USB it shows up with it’s name in the Developer menu and you can start debugging sites opened in Safari or chrome-less web apps. This also works with pages opened in the simulator and will make tools like iWebInspector obsolete. However, as it only works on iOS, there is still a gap when it comes to debugging on android devices which, so there is still a place for Adobe Shadow out there.
Update: The ink’s not yet dry on this post as Adobe discontinued Shadow and replaced it with Edge Inspect, which is part of the Creative Cloud and therefore no longer free.


